Check the glossary
We’ve put together a glossary of important or unfamiliar words. You can find them all here, and they will be highlighted where they appear in the guide. Hover over or click on them to find the definition.
Analysing and interpreting your results
This section provides an overview of how to analyse and interpret quantitative wellbeing data, including how to understand differences in wellbeing scores and be confident that your organisation is responsible for the change.
Measuring before and after changes and testing for statistical significance
As part of your before and after survey, you will be measuring changes in the wellbeing of your beneficiaries by comparing the mean scores of your sample for each outcome at baseline and endline.
You can report these as percentages or as point scores and compare the ‘group’ of before scores with the ‘group’ of after scores. You can also track individual baseline and endline scores for the same individuals at baseline and endline, tracking changes for each individual beneficiary.
If you find a positive change in wellbeing when you compare ‘before’ with ‘after’ results, you may want to know whether this difference is significant, that is, whether this change could be explained by chance or a random variation in results, or whether this change is systematic enough across your survey sample to be considered a meaningful change. You can find changes that are statistically significant, even if they are very small in size.
If you are familiar with standard statistical tests and analyse your survey data using software such as STATA or SPSS, you can run a Repeated Measures T-test to check the statistical significance of the change in mean scores. This test will generate a p-value, which will tell you how reliable the difference in scores is and how much the change recorded is down to chance.
There are several things to check before you decide whether to conduct a t-test. You can read about them here.
 If you want more information you can also email evaluation@whatworkswellbeing.org.
What if your evaluation shows that wellbeing drops after your activities?
Many organisations measure wellbeing to understand the difference they’re making to wellbeing, and they expect their evaluation to show they’re improving wellbeing.
But what if it doesn’t? Think about why this might be.
Try and learn from your data and think about what it tells you. Discuss it with staff and people who use your services. Think about why things haven’t improved, and what this might say about your organisation, your services and the people you support.
It’s not realistic to expect improvements or high scores for everyone.
Many people have complex lives and you probably can’t influence the negative impact this can have on wellbeing. But you may be able to help people maintain their wellbeing level, rather than improve it. If people have high anxiety, this could mean you’re reaching the people who need support the most.
Wellbeing isn’t always stable. Even when someone’s wellbeing is improving overall, there will still be some dips – which may be why a score is lower than you expect.
Scores can drop for various reasons, unrelated to your intervention. For example, someone could feel more comfortable being honest about how they feel as they develop closer relationships with people.
Qualitative feedback or focus groups can help you understand what’s happening. You may find out that parts of someone’s life are getting better, even though their overall wellbeing scores are lower. You can find out more about this in the section on Gathering qualitative feedback in this guide.
After carrying out your analysis and delving deeper by using focus groups, you may find you haven’t had an impact on wellbeing. In this case you might need to think about changing your services to better suit the people you support.
Covid-19: things to consider
The pandemic is affecting people’s wellbeing in multiple ways, and it will be difficult to isolate the effects of any single activity or factor. The best approach to interpreting your results in this context is to be very clear about your theory of change and your evaluation methodology, so you can try to identify the most likely effects of your project. It’s also very important to be transparent about your approach, and not to overclaim results when the wider context is so changeable.
Thresholds for key wellbeing measures
Once you have recorded your participants’ wellbeing scores, it may help you to use thresholds or categories that tell you something meaningful about their wellbeing. This will help you interpret any changes you may record between the start and end of your project or programme.
When using the ONS4 personal subjective wellbeing measures, you can use the thresholds below to group your respondent scores as: ‘very high’, ‘high’, ‘medium’ or ‘low’:
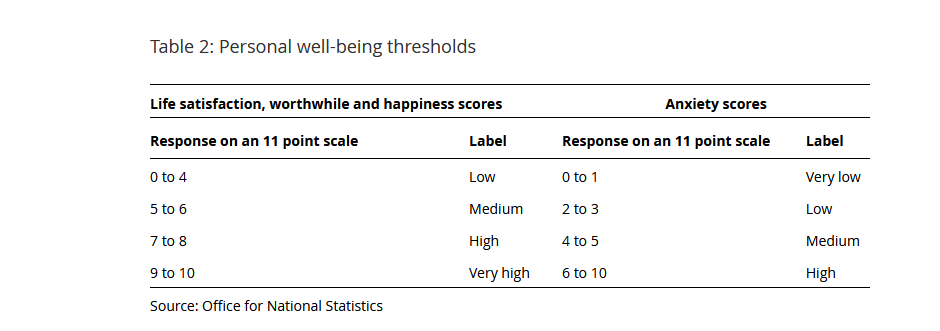
For more guidance on scoring the ONS4 see the Wellbeing Measures Bank.
When using the WEMWBS measure, you will be summing the scores for each of the 14 items, which are scored from 1 to 5. Scores range from 14 to 70, and higher scores indicate greater positive mental wellbeing.
When scoring the shortened 7-item scale SWEMWBS, sum all items, as with the WEMWBS scale. Warwick Medical School recommends that you then transform raw scores to 14-point WEMWBS scores using this conversion table. This will allow you to compare your participants’ scores more widely and to benchmark [glossary] more effectively.
For more information visit the WEMWBS website.
Benchmarking
Another way to interpret the wellbeing of your beneficiaries is to compare their scores against the national or regional picture, using wellbeing data from national surveys.
Benchmarking is about understanding how your group compares to others in the UK and to track changes in the wellbeing of your beneficiaries over time. It is likely that you will be comparing your beneficiaries’ scores either with average scores from a regional or local area and/or with individuals of similar backgrounds. You can compare your beneficiaries’ wellbeing scores with national, regional or local averages:
- At the start of your project – to help you understand whether you are targeting a group with higher or lower wellbeing to start with or to help you build a baseline if you can’t build one yourself
- At the end of your project – to make an informed judgement on the contribution of your project.
Here’s how you can compare your scores for the ONS personal wellbeing questions and WEMWBS:
ONS Measuring Wellbeing Programme
You can find the latest data, back series and demographics where applicable on the full set of ONS headline measures of national wellbeing here.
The ONS4 scores for adults have been split to show the differences for regions, age and gender. There are a few other ways the ONS4 personal wellbeing data has been split to allow for benchmarking:
- Wellbeing for personal characteristics – including self-reported health, economic activity, reason for economic activity, reason for part-time work, tenure, different levels of education;
- Split by protected characteristics, including sex, age, relationship status, ethnicity, religion, sexual identity and disability;
- At the UK and local authority level;
There are some population groups that are not captured in the data collected, either because the information isn’t collected or the sample size is too small to show significant change. Some examples of these groups are:
- homeless people
- incarcerated people
- data on some minority groups (e.g. sexual minorities)
- Data at the lower neighbourhood level
The ONS4 scores for children and young people’s wellbeing data are:
- Young people’s wellbeing (16- to 24-year-olds) including domains: personal wellbeing (including ONS4), our relationships, health, what we do, where we live, personal finance and education and skills. Collected by ONS.
- Children’s wellbeing (0- to 15-year-olds, range depends on the question) including data for the 31 measures of children’s wellbeing, within seven domains and complementing the national measures of wellbeing. Domains are: personal wellbeing (excluding the ONS4 question on anxiety); relationships; health, sport, arts and culture; local neighbourhood and educational achievements. Collected by ONS, The Children’s Society and Understanding Society, among other national surveys.
These spreadsheets show mean as well as threshold data.
If you would like to research wellbeing from the Annual Population Survey, you can see the End User Licence version of the dataset at the UK Data Service.
Subgroup analysis
In any wellbeing evaluation you’ll want to know whether your wellbeing impacts differ across different population groups – for example, if the positive impact of volunteering is greater for young people or for women.
You can define your subgroups by a variety of characteristics – for example, you may be interested in observing improvements in the wellbeing of a specific group, or the evidence base might suggest that your service is more or less effective for people with specific backgrounds.
In order to conduct subgroup analysis, you will need to identify the subgroups you are interested in analysing and then split your data into separate sets. For example, if you are interested in investigating wellbeing impacts by gender and age, you might have two subgroups:
| Age | Female | Male |
|---|---|---|
| 18-49 | 18- to 49-yr-old females | 18- to 49-yr-old males |
| 50+ | Females aged 50+ | Males aged 50+ |
By conducting subgroup analysis, you can help improve our understanding of wellbeing inequality – the extent to which people’s experiences of life vary within a population or between groups.
Individuals can hold more than more subgroup identity at anyone time and you may want to think about intersectionality to ensure you have captured all the thigns that matters for the wellbeing of your beneficiaries.
Analysis using socio-demographic factors
Given that wellbeing is correlated with several socio-demographic factors, you can use an Ordinary Least Squares Regression (OLS) to calculate wellbeing scores taking into account the effects of other factors.
What to control for
Wherever possible, try to control for the factors below as they can affect wellbeing independently from your project or programme:
- Age and age squared
- Gender
- Ethnicity
- Health and disability (using objective measures where you can)
- Relationship status
- Economic activity or employment
- Income
- Religion
- Highest qualification level
- Dependent children
- Occupational group or status
- Housing tenure
- Interview type
- Region or location
Addressing causal questions – who takes credit for your results?

When you deliver services and activities, your work exists within a wider system. It’s important to understand what contribution other people or groups make to any changes to wellbeing or to measure your attribution directly, to help ensure you are not overclaiming.
In any outcomes or impact evaluation, you will want to know whether your organisation is responsible for any wellbeing changes you record, and the first step is deciding how you want to explore or measure this:
- contribution and attribution analysis are ways of assessing causal questions in your evaluation.
- Contribution approaches explore how your project or programme has contributed to wellbeing outcomes or impacts, alongside other factors.
You will often use your Theory of Change to make an argument for having caused wellbeing changes and describe the context and mechanisms that have made this possible.
Some approaches include:
- Making an informed guess or using expert judgement. Ask your staff or other experts to judge how much credit you can take for wellbeing changes, based on the frequency and intensity of support provided, as well as the role of other organisations in generating wellbeing changes. This can be reported quantitatively – for example, ‘50% because we provide support 3 days a week’. This approach is used in Social Return on Investment (SROI) analysis
- Asking people about the other support they receive and whether it has made a difference to their lives. Work with participants to map all the people and organisations that support them in their lives, and assess the contribution of each.
- Conducting a more structured analysis of contribution. Build a ‘contribution story’ using your Theory of Change to infer causation. You will need to assess qualitatively whether the processes you describe have actually occurred.
You can check whether your project or programme has plausibly contributed to wellbeing outcomes by thinking about whether:
- your Theory of Change is clearly set out;
- your activities are shown to have been implemented as they’re set out in your Theory of Change;
- your results or outcomes chains appear to have occurred;
- other contributing factors have either been shown to not have made a difference or their relative contribution has been recognised.
For more advice on using contribution analysis to address attribution issues read the guidance on BetterEvaluation
Attribution analysis
In attribution analysis, the focus is on proving causality using quantitative analysis. You will look for evidence of sole attribution of wellbeing changes to your project or programme, and you can do this by comparing the effects of an intervention to a counterfactual situation, or what would have otherwise happened:
Set up a control group
If resources allow, you can use a control group – sometimes called a comparison group – to estimate the extent to which your organisation is responsible for any observed changes in wellbeing. Your control group will be made up of individuals who are similar to your beneficiaries but who haven’t taken part in your activities or received an intervention.
They will be your counterfactual and help you estimate what would have happened in the absence of your project or programme. The way you create your control group will depend on your evaluation design and what your resources and expertise allow for.
Ideally, the individuals in your control group should be as similar as possible to your beneficiary group – and include a similar mix of socio-demographic characteristics.
With every control group there will be a trade-off between a rigorous design and the cost of set-up. Below are some common types of control group:
Randomised allocation. This is a method found in experimental designs such as Randomised Control Trial (RCT) and represents the gold standard for creating a rigorous counterfactual. By using a randomisation approach you will make access to your project entirely random within your target service user group and then compare the outcomes of the group that has accessed your activities or programme with the group that hasn’t.
For more information on RCTs go to Poverty Action Lab.
For an example of a wellbeing RCT of a psychological intervention see here.
Matching. This method is used in quasi-experimental designs when using an entirely randomised approach is not possible. Creating a matched control group involves matching individuals who attend your project or programme with a group of people who don’t but have similar characteristics.
You will use statistical techniques to ensure that any differences in scores between treatment and control groups are not due to observable characteristics such as age, education and occupation. This will help you attribute impact more reliably.
Wait list control. This method is the easiest to implement and involves comparing the scores of your beneficiaries to those of a motivated group of individuals who are on a waiting list to attend or receive your project or programme at a later date. The waiting list can also be randomly created to increase the rigour of your design.
Help us find out what works
We hope this guide is useful for you and that you can use your results to prove and improve the effect you have on people’s wellbeing.
We also hope you’ll help us build a national evidence base of what really works to improve wellbeing. If everyone who uses this guide shares their results with us, we can find out how we can all make more of a difference to wellbeing across the UK.
So if you’re measuring wellbeing already or you plan to measure wellbeing using this guide, we’d love to hear from you. You can email your results summaries, case studies and evaluation reports to: evaluation@whatworkswellbeing.org
Share your evaluation